Feature Spotlight – Introducing the New Threat Center
We’re excited to announce our new Threat Center, offering a range of new features and a complete redesign of our threat management interface in the SentinelOne console. Threat Center helps your security team manage threats faster and easier, while at the same time enabling analysts to dive even deeper into the data. The new features are available to all customers with the latest Kauai release.
In this feature spotlight, we’ll explore what’s new with Threat Center and show how analysts can handle threat management more effectively than ever before.

What Problems Do Threat Hunters Face?
Our on-device agent delivers a wealth of information to the console, but to maximize effective use of it, we wanted to redesign our interface around the way analysts work in solving their day-to-day problems. In essence, we wanted to provide streamlined workflows to help analysts meet the following challenges:
- Understanding that a new threat exists, without the burden of alert fatigue
- Accessing all relevant data with a minimum of UI interactions
- The ability to rapidly perform top-down analysis on a new threat
- The ability to take different mitigation measures from a single window
- Easy access to logging and improved collaboration features
Our new Threat Center has three tabs, ‘Overview’, ‘Explore’ and ‘Timeline’ and a one-stop-shop mitigation window that together effectively handle these challenges. Let’s see how it works.
Understanding the Threat
From the Incidents page, click on a threat to go to the new Threat Center interface.
You’ll see there are three tabs, Overview, Explore, and Timeline, with the new Status bar common to each for fast, effective threat management.
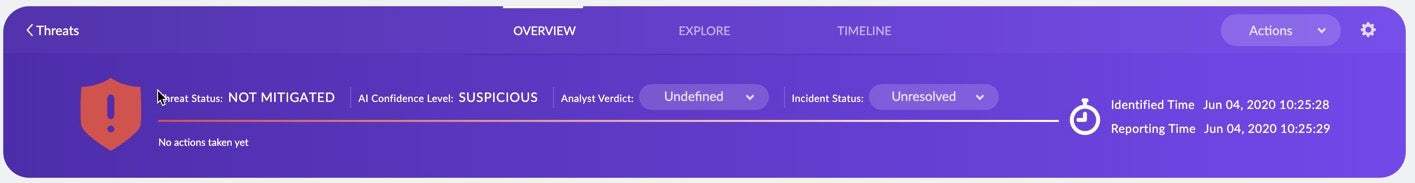
The new interface immediately allows you to see the status of a threat and what the agent’s AI thinks about it.
It allows you and your team to see at a glance:
- The Threat Status – has the threat been mitigated by policy or not?
- The AI Confidence Level – is the threat regarded as suspicious or malicious?
- The Analyst Verdict and Incident Status – mark up the threat so the rest of the team knows whether it’s in progress or not yet been dealt with.
In the Overview tab, right below the Status bar you’ll see network history, which will instantly answer questions such as:
- Is this the first time the threat has been identified on my network?
- If not, when was it first seen and last seen?

You can also click from there to directly begin a new hunt for the threat in Deep Visibility.
Without changing the view, you can also see right from the same page detailed information such as:
- Which process initiated the threat
- Which detection engine identified it and whether it was statically or dynamically detected
- How the threat is classified. For example, whether it is ransomware, a backdoor or a trojan
- Whether the process is signed and verified, and if so, by whom.
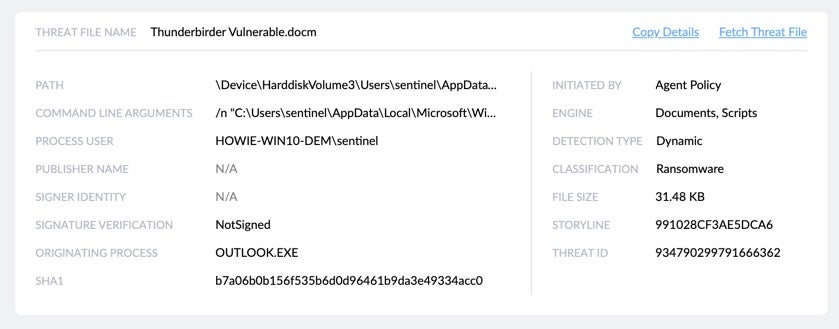
Also, if you want to analyze the threat or detonate it in your own sandbox, you can fetch the threat file directly from the same view.
Fast, Easy Access to All Relevant Data
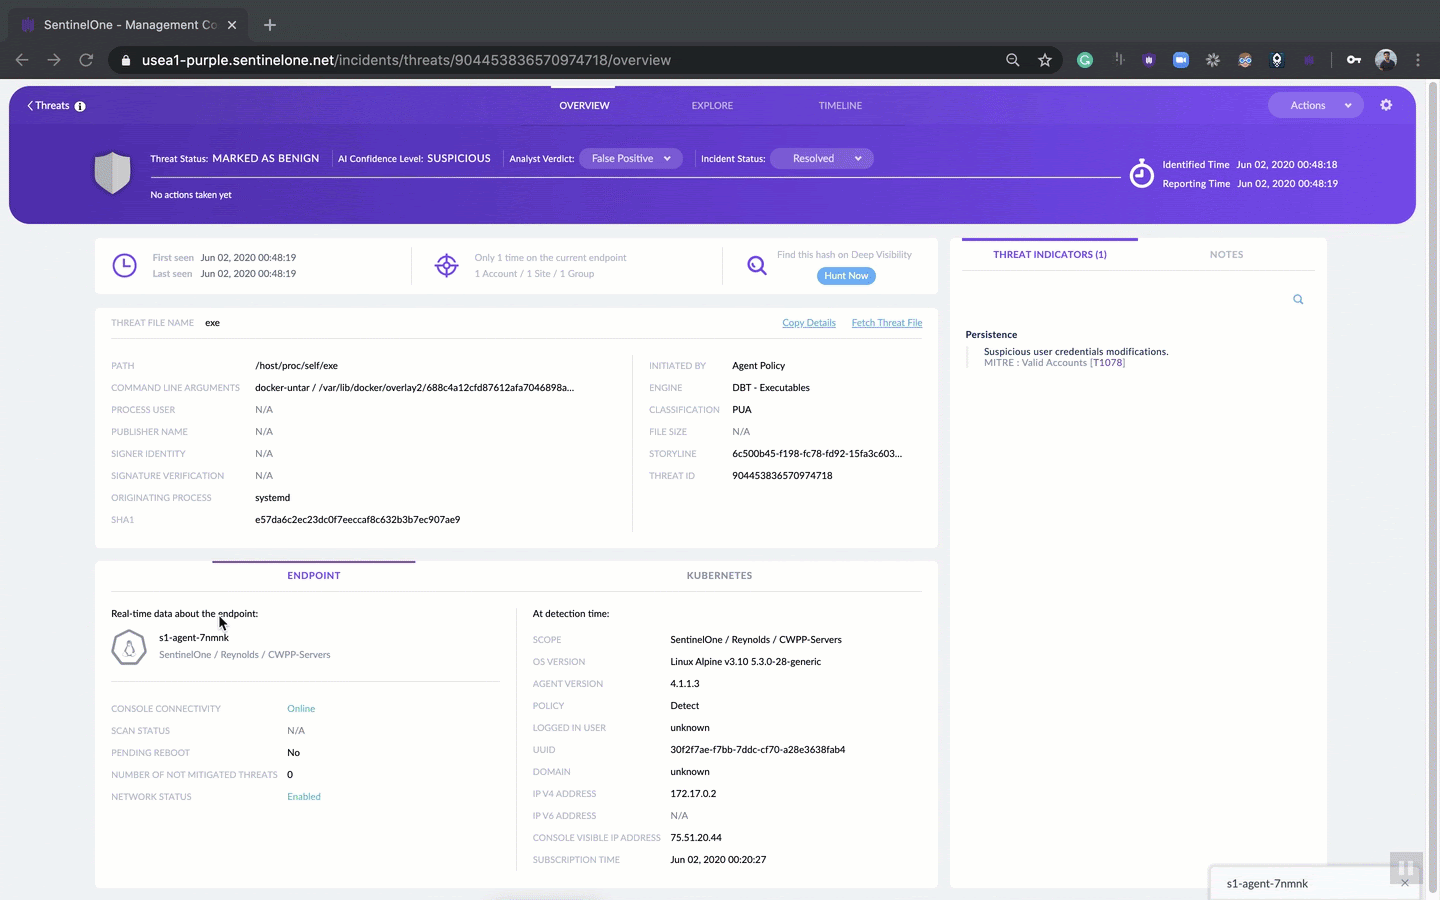
Sometimes, there might be a delay before an analyst starts to review a threat. Many things could have changed during that period: the OS may have changed version, different users could have logged into the endpoint, the protection policy may have changed and more. For this reason, below the threat details we show a snapshot of the endpoint as it was at detection time.
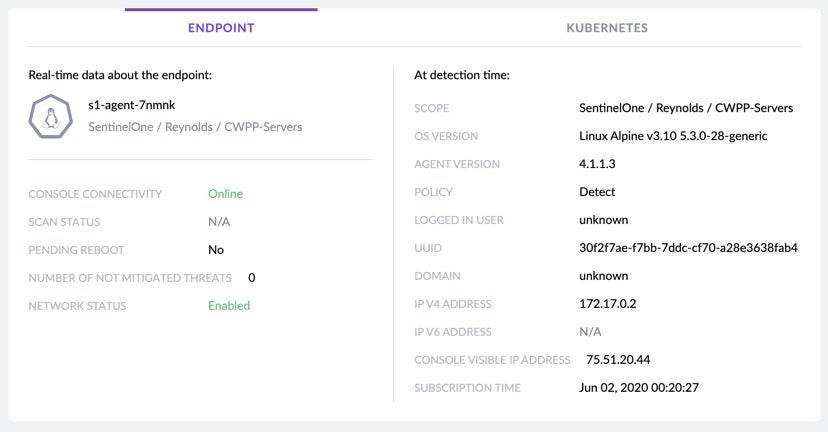
On the left side of the snapshot, we show the real-time data that we think is the most important to the analyst during investigation. The analyst can see if there are other threats that need attention, whether the endpoint is currently online, and whether the endpoint is quarantined from the network.
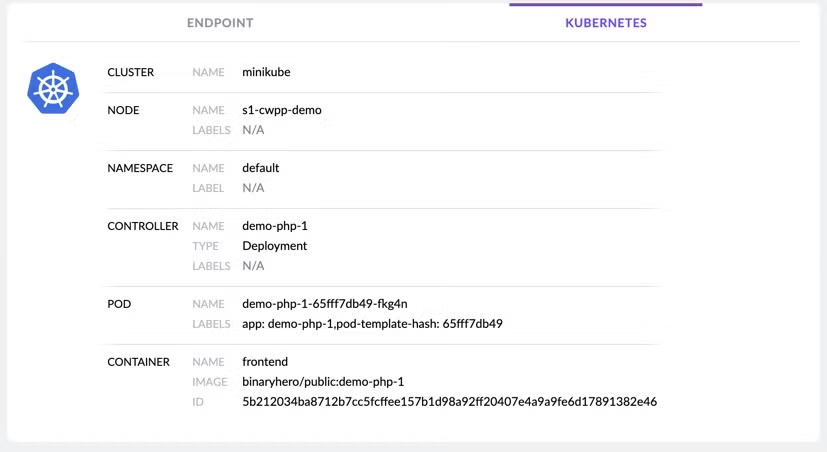
If you are using our new CWPP Agent, you can get full visibility about the pod on which the threat was detected, and afterward, take any action directly on the pod like quarantining the threat or any other available mitigation action.
Even better, from this one interface, you can initiate multiple actions, such as view real-time data about the endpoint, start a remote shell, quarantine the endpoint and more.
Rapid Top-Down Analysis with Threat Center
We want to help the analyst understand why the on-device agent AI convicted the threat. We do this by showing the analyst which MITRE techniques were being used as part of the detected attack in the Threat Indicators view on the right-side of the Overview tab.
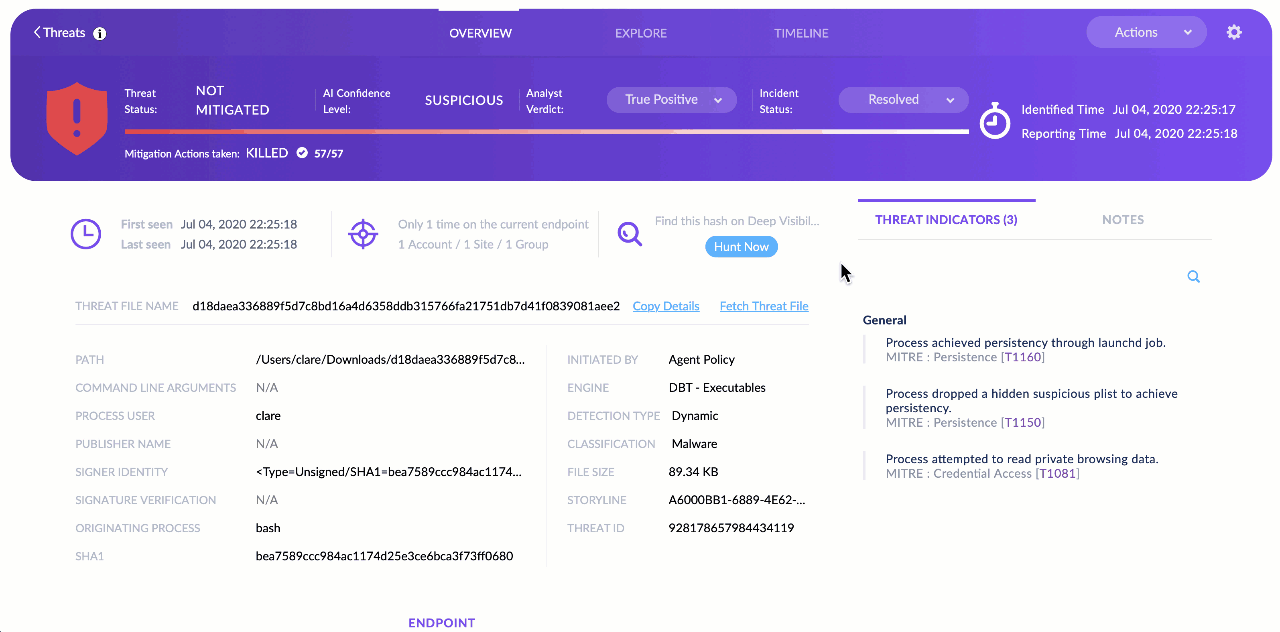
If the analyst needs more information on any of those, the MITRE ATT&CK TTPs are hotlinks that will open the relevant page from the MITRE website.
For Analysts Who Need More, There Is Explore
But there’s much more to explore in our new UI for the analyst or team that wants to dig further down into the details of the attack. Click the ‘Explore’ tab and you can view the entire attack storyline, find what triggered the threat, what tools and commands the attacker used, and most important of all, how to prevent this attack from occurring again.
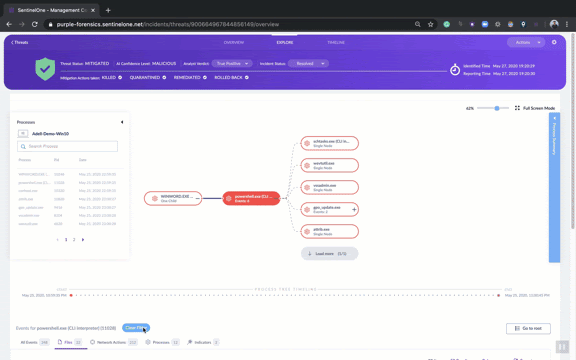
Analysts can easily see all processes, files, registry modifications, network activity and other interesting events related to the threat. The Explore tab shows what each process did, which files it created or modified, which child processes it created, what network actions occurred like IP connections and DNS queries, whether there were Registry changes, and much more.
All this data can be viewed in the Process Tree view or through a tabular view at the bottom of the page.
Every Activity Logged in the Threat Timeline
The third major tab in the new Threat Center is the Incident Timeline in the ‘Timeline’ tab.
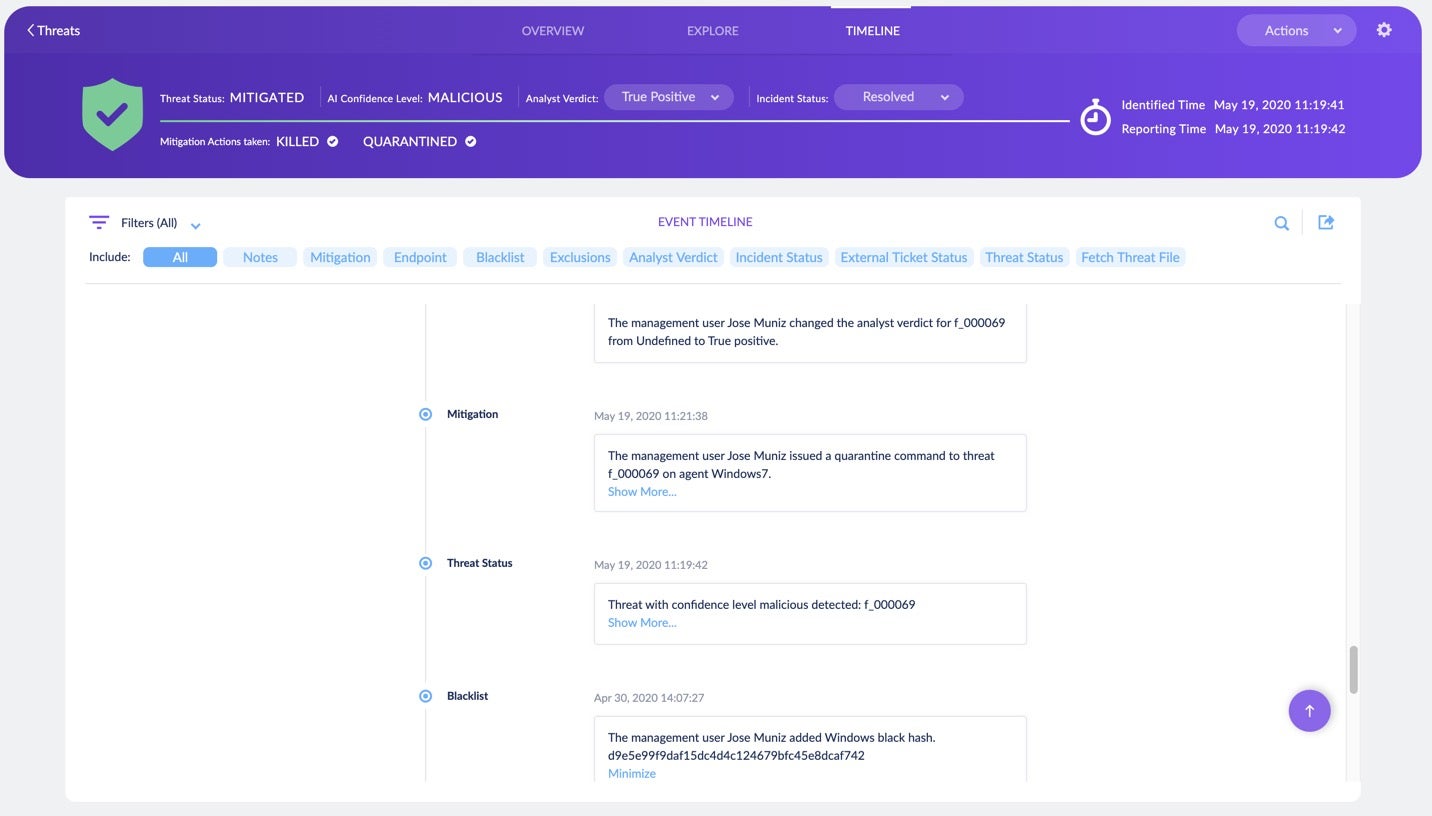
Logging actions and decisions has always been a crucial responsibility of the analyst. It can be used both during and after an investigation in situations such as
- Improving analysis – tracking each action and explanatory notes that the analyst makes on each threat
- Improving team collaboration – what did another investigator do, and when?
- Going back in time to understand who decided, say, to add an item to the exclusions list and why.
That’s why we created the Timeline. This tool captures every activity of the analyst, the console and the Agent that is related to the threat. In the Timeline, you can find mitigation actions, endpoint activities, notes, mitigation reports, fetched logs, and more.
Know What You Want To Do? Use Our One-Stop-Shop Mitigation Window
Sometimes, the analysis process eats up time, but once we know what action we need to take, we want to take that mitigation action without delay.
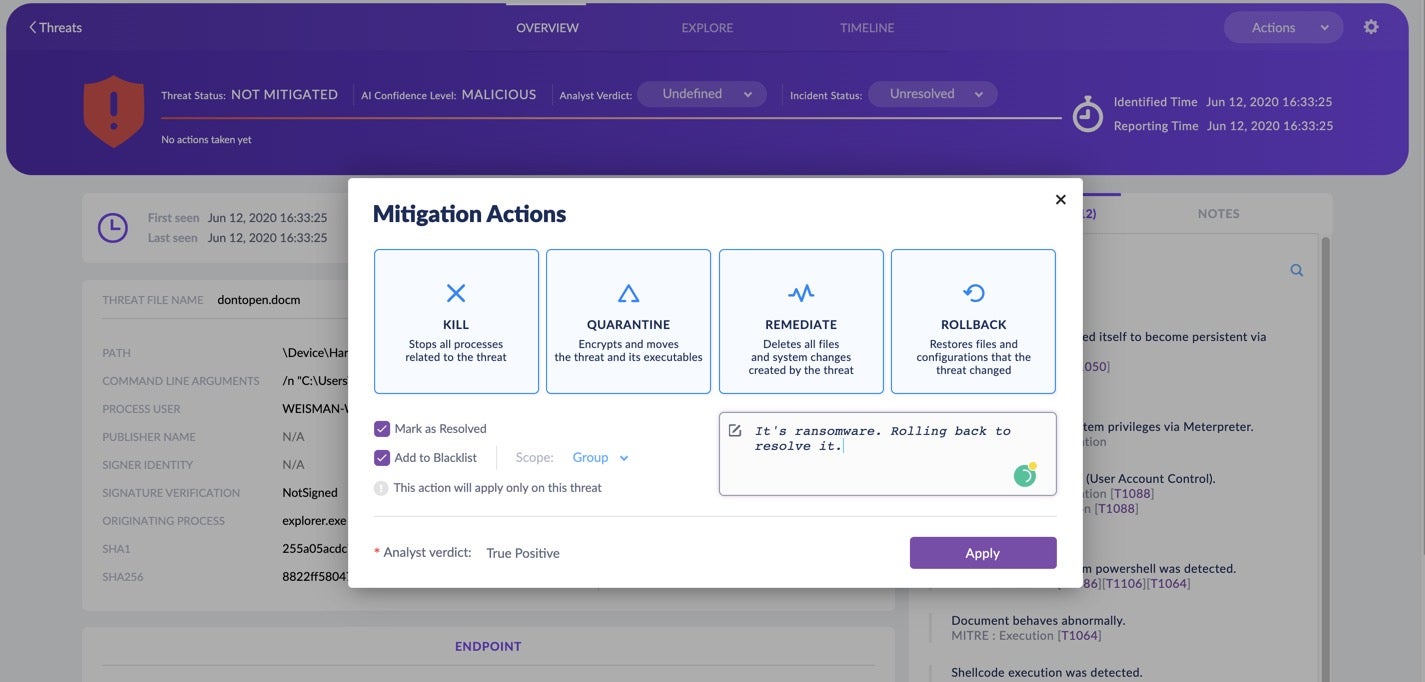
To facilitate that, Threat Center enables the analyst to take all the required actions needed to complete work on the threat. With one click, the analyst can rollback the threat or perform any of the other available mitigation actions. The threat can be added to Exclusions, marked as resolved, and notes can be added to explain the rationale behind the decisions taken.
See What The Agent Really Did To The Threat
Visibility is always important. It’s not enough to say that we “mitigated” the threat. Analysts want to know what exactly the Agent did and when.
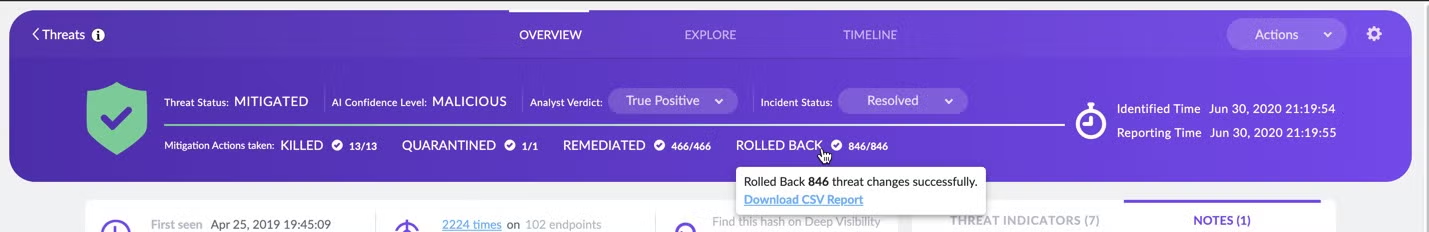
This is why we provide full visibility about what the Agent did: how many processes were killed, which files were quarantined, which new files created by the threat that we deleted, and which items were rolled back and to what state.
On top of that, if the analyst needs more than a summary view, the full report is just a single click away.
Conclusion
Analysts have a big responsibility, and sometimes they see lots of threats on a single shift.
We want to make sure they can analyze a threat in minimum time, make use of decisions taken in the past on similar threats, reduce manual mistakes, collaborate with the team and understand how to avoid those threats in the future. We believe the new Threat Center offers teams the most effective way to achieve those goals, but we’re not done yet. We continue to listen to customer feedback and to innovate, so you can be sure you’ll see more features and improvements to Threat Center in future releases.
Like this article? Follow us on LinkedIn, Twitter, YouTube or Facebook to see the content we post.
Read more about Cyber Security
- “EvilQuest” Rolls Ransomware, Spyware & Data Theft Into One
- How Do Attackers Use LOLBins In Fileless Attacks?
- How a New macOS Malware Dropper Delivers VindInstaller Adware
- Ransomware – A Complex Attack Needs a Sophisticated Defense
- macOS Big Sur | 9 Big Surprises for Enterprise Security
- The CISO Side: A Certifiable Journey
- Next-Gen AV and The Challenge of Optimizing Big Data at Scale
Leave a Reply
Want to join the discussion?Feel free to contribute!